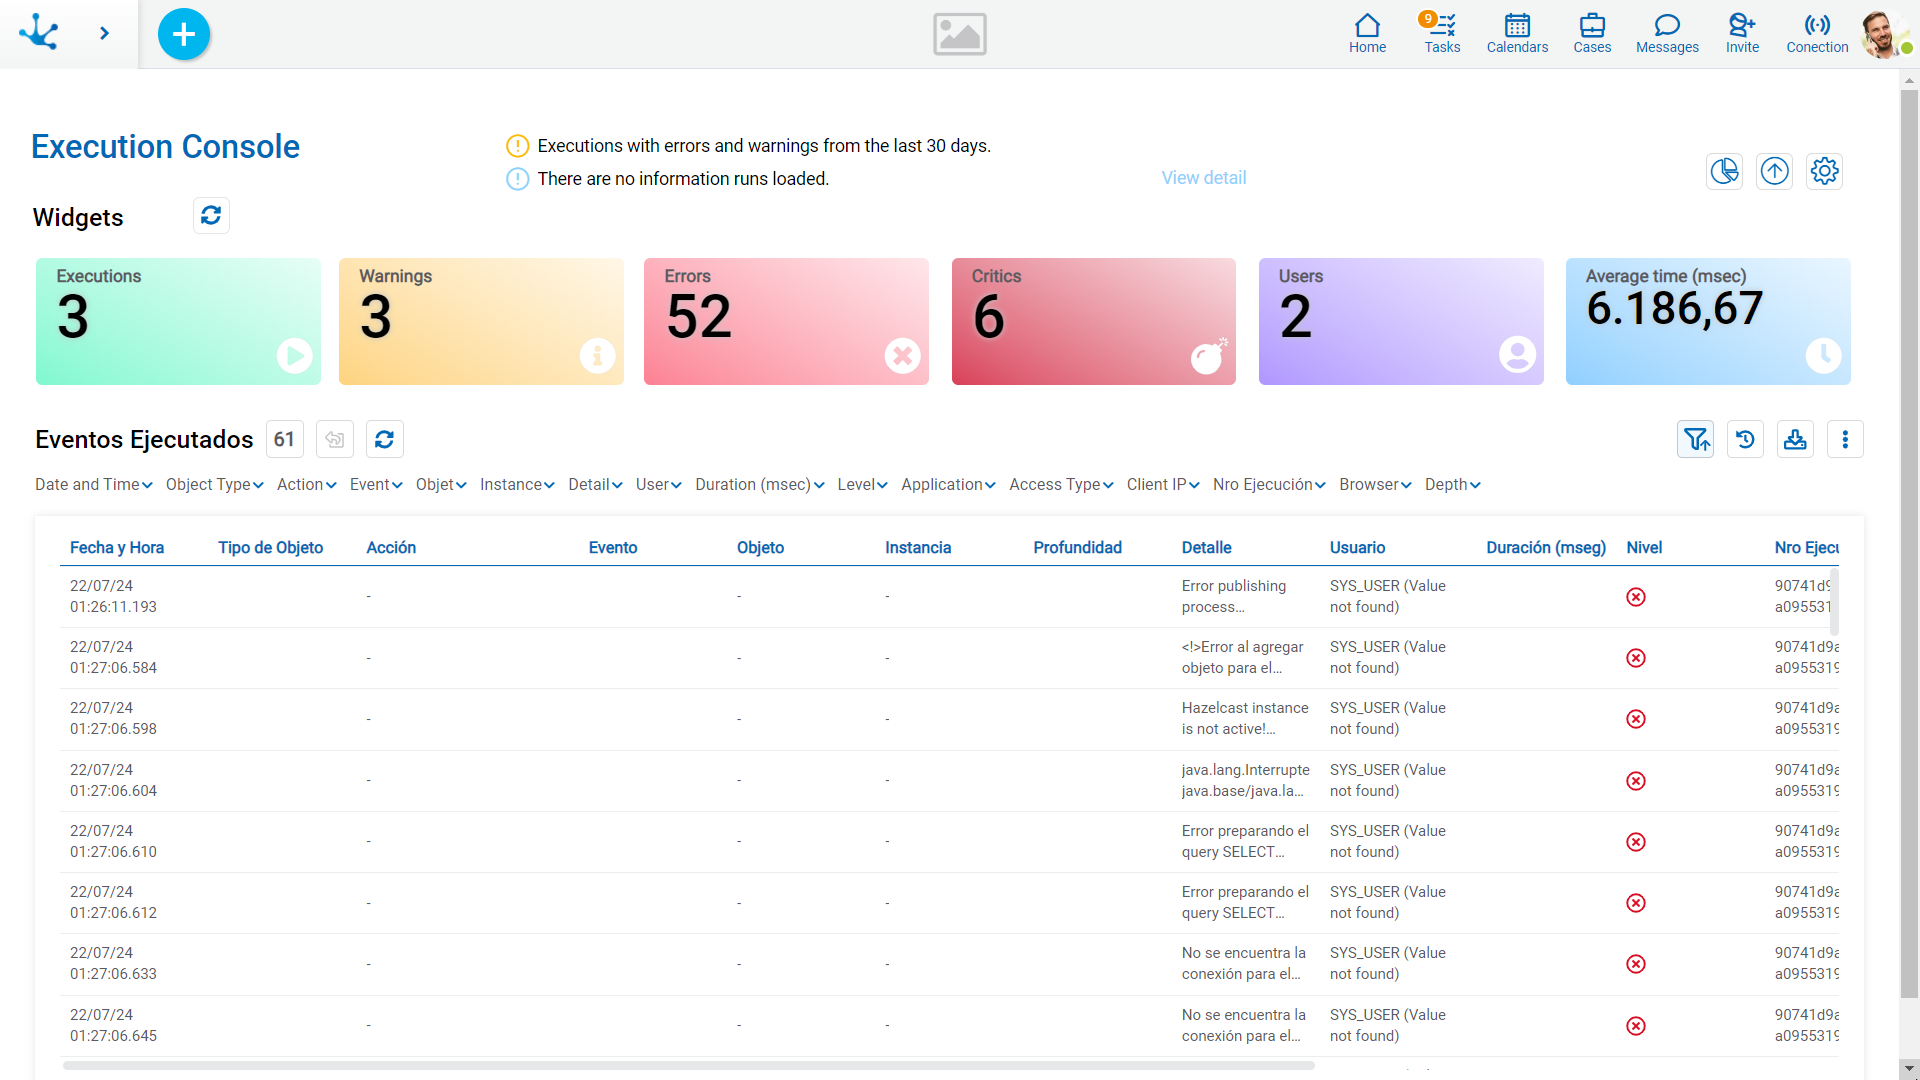
Application Execution Console
This console allows to review the execution of the applications modeled with Deyel by recording the actions performed when executing the modeled objects.
To carry out the analysis, different levels of registration can be defined, which allow knowing the behavior of the applications according to the needs of the modeler user. For example, in development environments everything that has been executed can be known, while in productive environments it is necessary to focus on performance improvements or check if there are errors.
For each action, the executions register a start and an end event, indicating in each one the date and time of completion, the type and object involved, the executing user and additional information about each action, among other things.
The end events also indicate whether the execution ended correctly, with warnings or with an error, with the details in each case.
Starting an execution can generate executions on other objects. For these cases, the start and end events of these executions are presented nested within the start and end events of the initial execution.
The console incorporates indicators that provide an overview of how many executions were performed, how many users participated, whether there were warnings for slow executions or errors for a given time range.
To deepen the analysis, the execution event grid that has different search criteria can be used, where the user can filter by applications, by object type, by user, by IP address, as well as by the content of the modeled embedded rules. So that the user can have complete detail of how, when and who executed their applications.
To configure and use the console, the following steps must be performed:
•Configure the register level that determines what is going to be saved.
•Execute the objects to register the actions of the defined register level.
•Make the records loading in the records grid.
•Analyze the indicators and check the details of the records from the records grid.

When entering the console, the widgets and the grid are displayed with the records loaded on the dates indicated at the top.
These dates can be modified by entering the desired range and clicking on the icon  the widgets and the grid are updated.
The values of the widgets and the grid records include the executions made within the period indicated in the dates and times entered.
The dates and times included in the analyzed period have as default value, the time period from the oldest execution to the last one loaded into the console.
In the case that there are periods that are not loaded in the console, a message is displayed indicating which periods are missing.
The dates and times of the executions are shown in UTC-3.
Widgets
The widgets provide an overview of the executions made for the indicated time period.
They can be hidden clicking on the icon  and then to view them again the same icon is used.
Executions
Indicates the total number of execution end events recorded for all levels.
Warning
Indicates the total of executions with end events that exceed the maximum expected duration. The duration time is defined in the environment property Maximum time.
Errors
Indicates the total number of executions with end events that have an error; these errors can be ERROR or CRITICAL level.
Users
Indicates the number of users that performed the executions.
Average time
Indicates the average time of all the executions.


