Connection
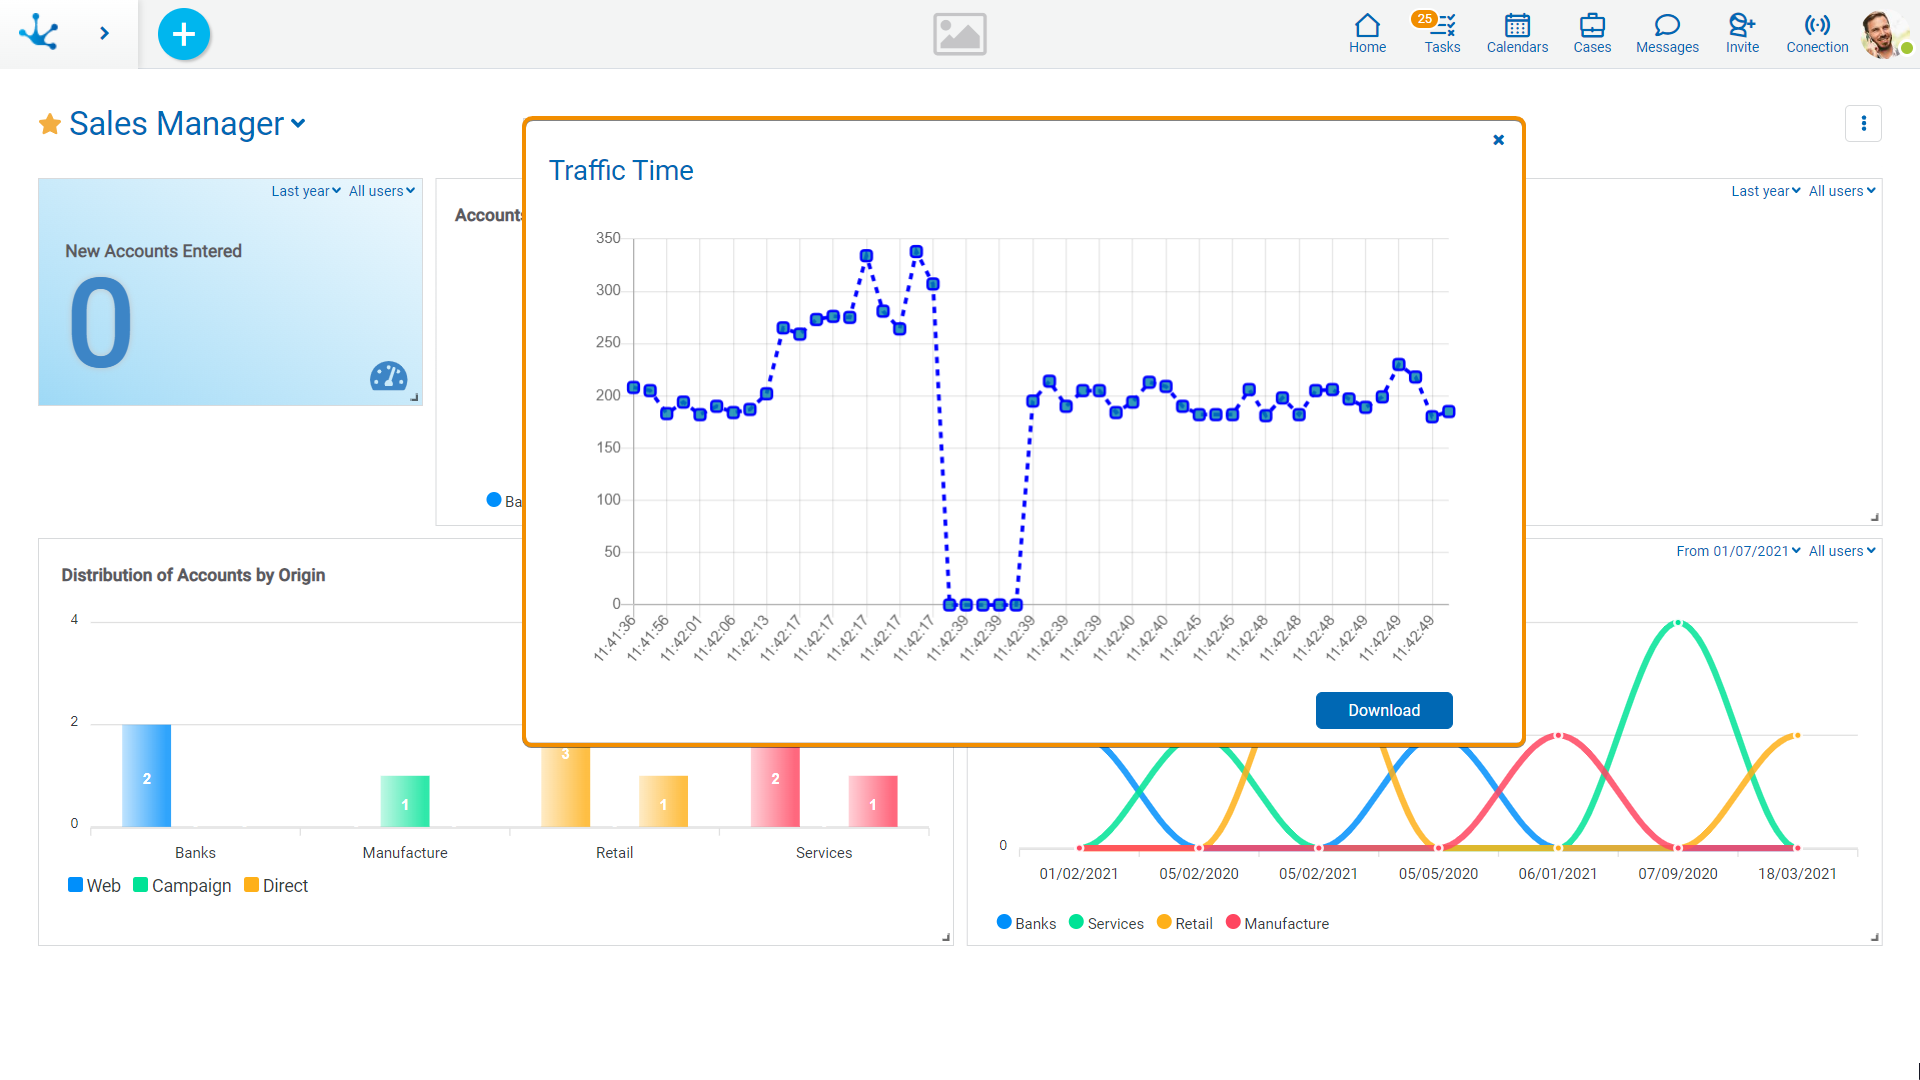
By pressing the connection icon on the top toolbar, a panel is displayed with a graphic that allows to show the connection state for each of the monitored actions that are executed.

For each of the actions, the date and time of its execution, the name of the action, the user who performs it, the IP address from which it executes, the time it takes on the server, the traffic time and the status are registered.
To visualize the connection icon on the top toolbar, the Connection Monitor property must be activated, from the user profile preferences.
In the graphic, the traffic time that each action took is displayed on the vertical axis, and the time at which it was executed on the horizontal axis. The traffic time is the sum of the times it takes for the network to reach the server, return from the server and display the data on the screen.
Hovering the mouse over each point on the graphic displays the information recorded for the corresponding execution.
The state is one of the data that is recorded for each execution. It can take the following values:
•200: Indicates the traffic time has been correctly evaluated. When the state is 200, the connection icon shows different colors according to the traffic time.
 Correct: When the time is expected.
 Warning: If the traffic time surpasses 1.5 seconds.
 Error: If the traffic time surpasses 3 seconds.
•408: Reports an error or a delay of more than 15 seconds (browser maximum timeout). Reasons for the 408 state include: the request did not reach the server, the response from the server did not reach the browser, or an unexpected error occurred in the browser.
 Error: If an unexpected error occurs in the browser.
Download Execution Detail
By pressing the “Download” button a text file is generated with the information registered for the last 50 executions.
The information contained in the file is:
•Date and time of execution
•Name of the executed functionality
•User that makes it
•IP direction from which it executes
•Time taken by the server
•Traffic time
•State


