Bars and Columns
The bar and column widgets, comprehend the charts of type: bar, grouped bar and stacked bar, column, grouped column and stacked column and N Top.
They are used to compare different data series.
To the properties shared by all the widgets are added those specific to bars and columns.
Properties
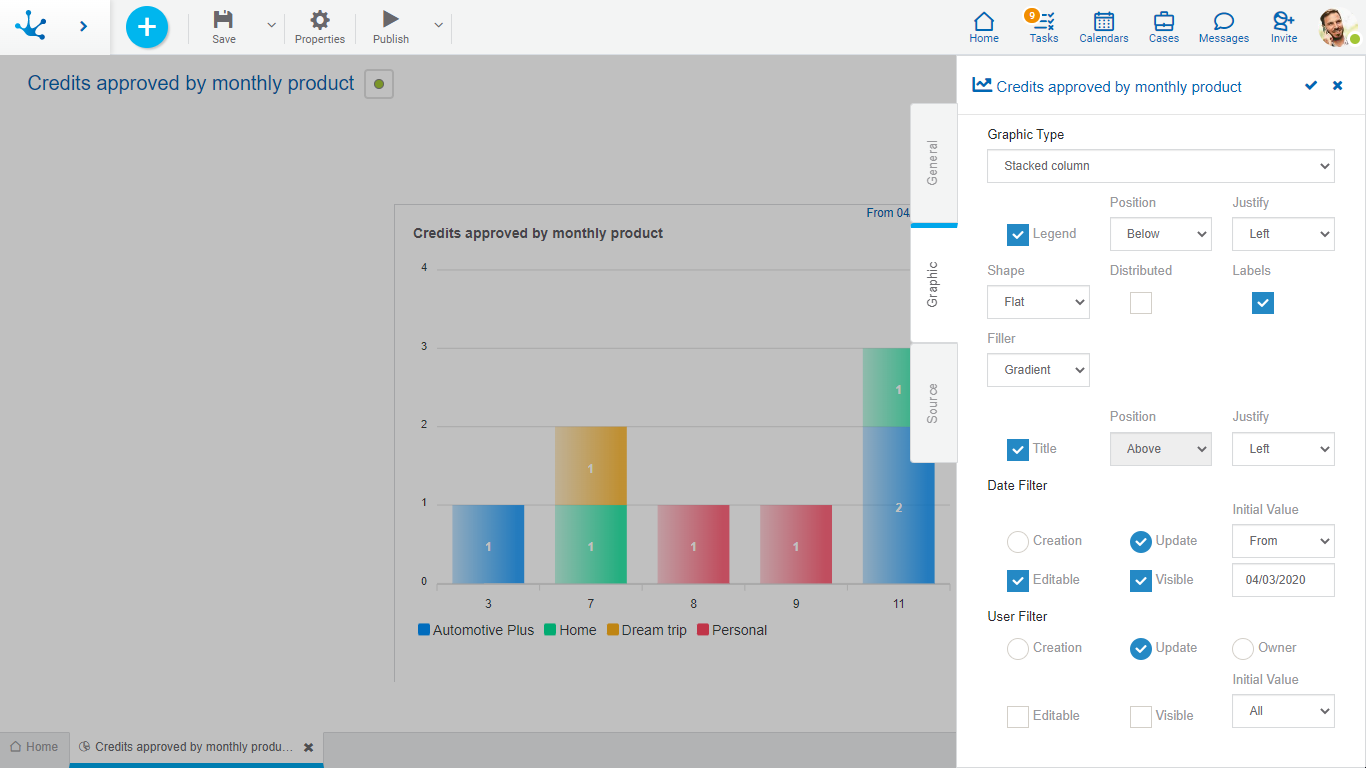
Legend
Indicates the incorporation of the data series description.
If this property is selected, it must also indicate:
Position
Select above or below.
Justify
If above or below position is selected, it allows to indicate right, center or left alignment.
Shape
Allows to select if the shape has a plane or rounded border.
Distributed
Indicates whether the series are grouped or interleaved.
Labels
Allows to indicate whether the labels corresponding to the data series are displayed.
Filler
Allows to highlight the area of data series in a gradient or solid way.
Example of Use
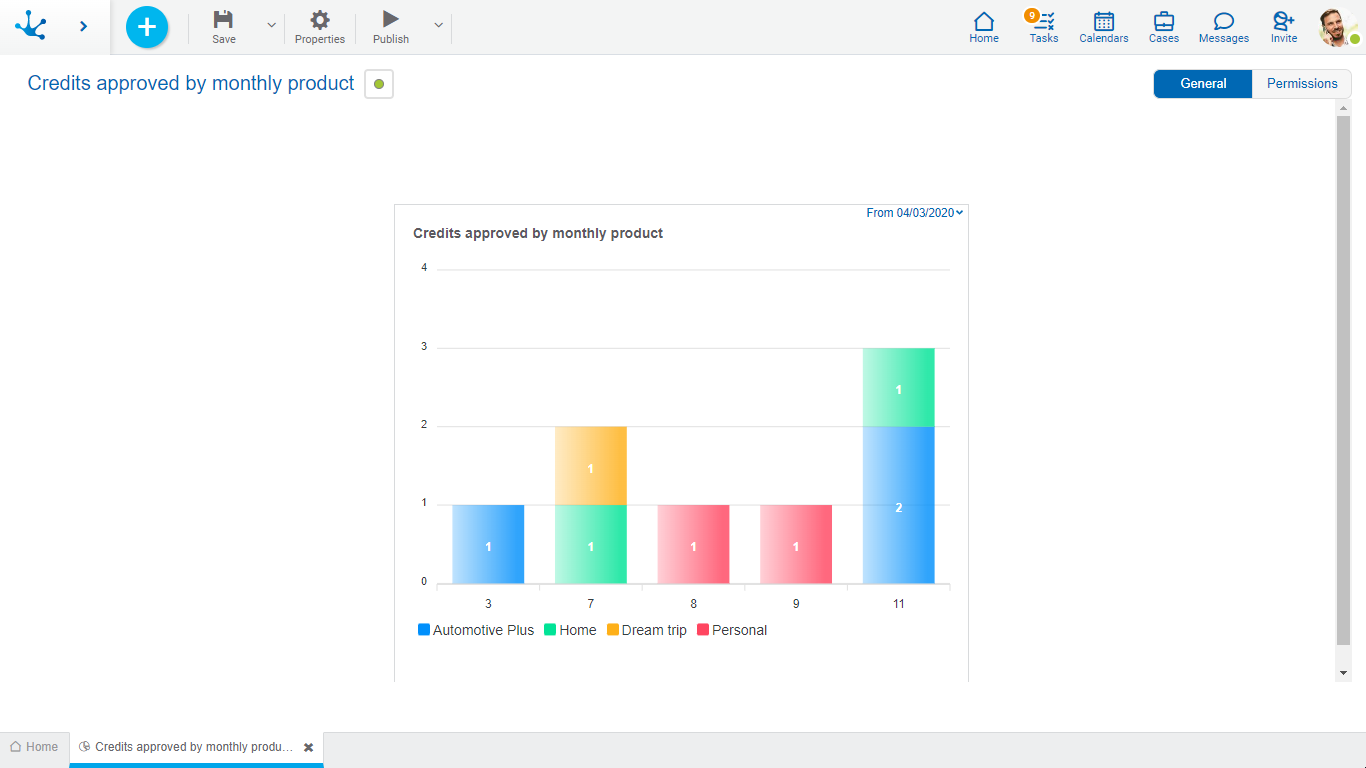
This stacked column widget shows the number of credits approved by range of expenses, during a selected period and for the users indicated in the filter.
The months are represented on the horizontal axis and the number of credits approved for each month is represented on the vertical axis
The percentage of each product is given by the colored surface, and the grouping of all surfaces represents the total number of approved credits.
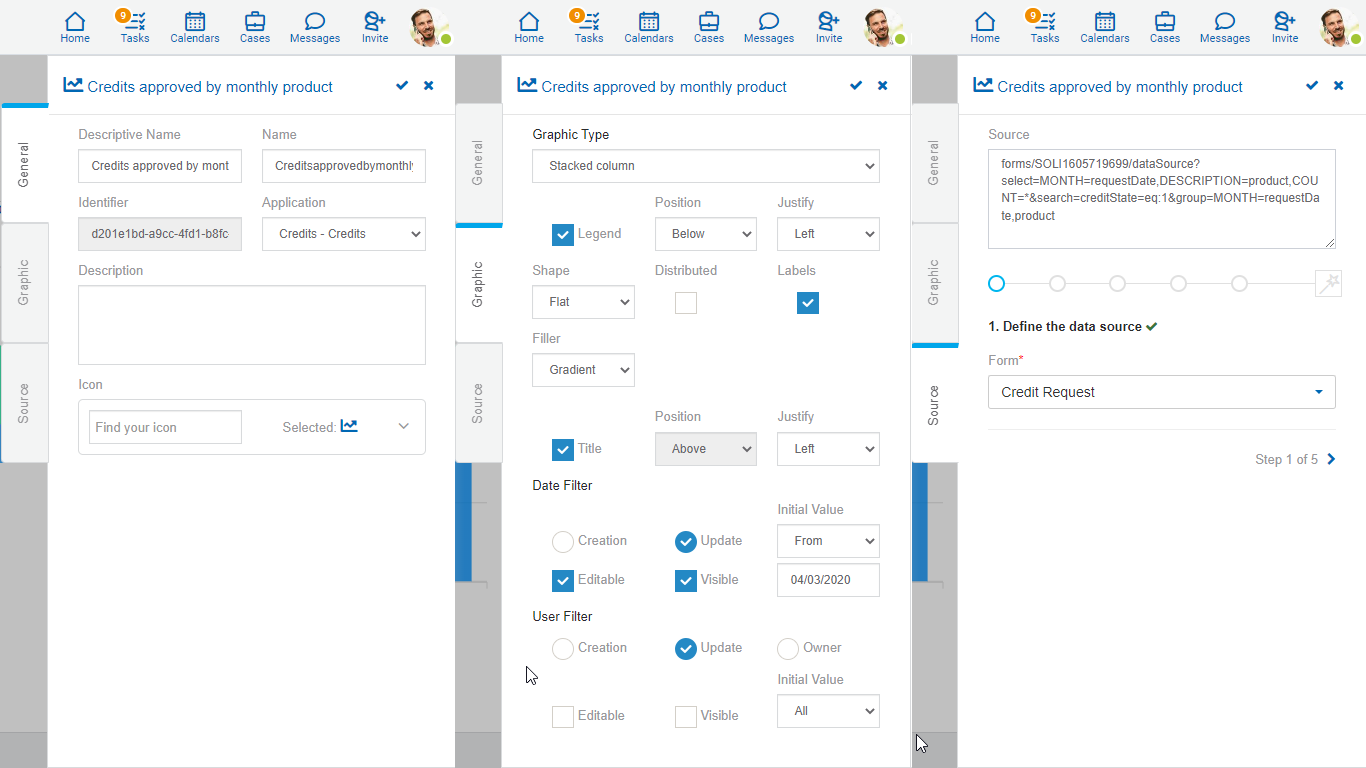
The source code to model this chart is detailed.
Steps of the Modeling Wizard
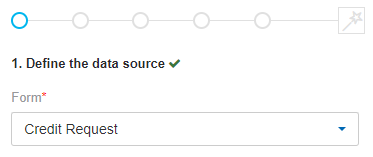
The "Credit Request" form from which the data displayed in the chart is taken should be selected.
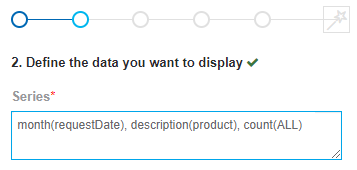
First the “month(requestDate)” function is used to determine the month of the loan request that is displayed on the horizontal axis of the chart. Secondly the "product" field that corresponds to the height of the column is indicated. And lastly the “count(ALL)” function is used to determine the number of loans per product per month that are displayed on the vertical axis.
For fields that use value lists, the "description()" function must be used to display every list value with its descriptive text, otherwise the numerical code is displayed.
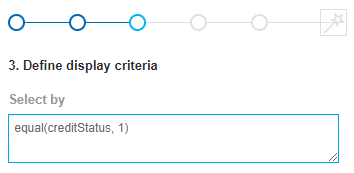
A condition is added to display all requests with "creditState=1" where "creditState" corresponds to a value list with numerical code "1" and descriptive text "Approved".
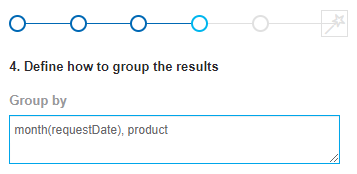
Grouping the results by the same form fields that were modeled in step 2 is defined.
In this step, the names of fields must be used without the "description()" function, despite being value lists.
Step 5 reporting that all steps are met is completed .

