Pies and Donuts
The pies and donuts type indicators are used to show parts of a whole. They represent the amount of segments in percentages and the total sum is equal to 100 %.
To the shared properties by all the widgets are added those specific to pies and donuts.
Properties
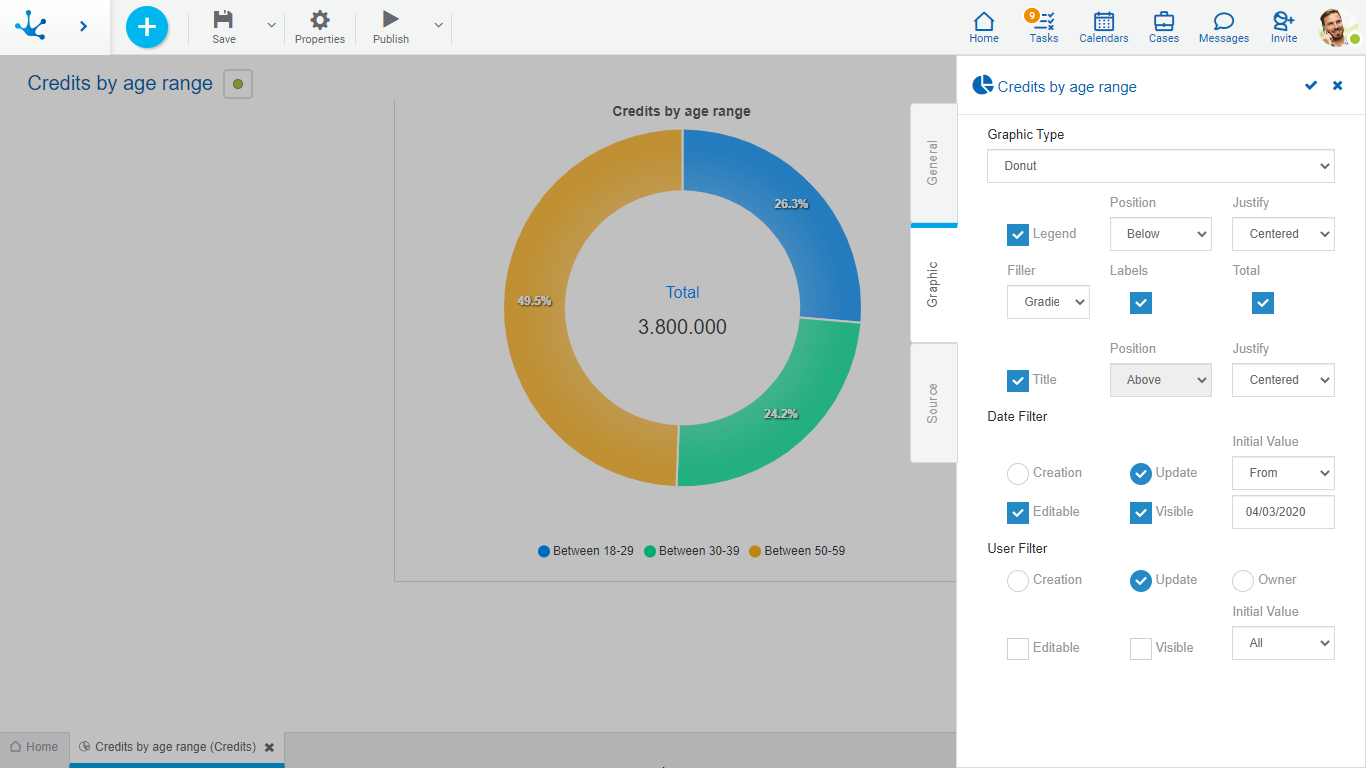
Legend
Indicates the entry of data series description.
If this property is selected, also indicate:
Position
Select above, below, left, right.
Justify
If above or below position is selected, it allows to justify right, center or left.
If right or left position is selected, the legend is displayed top right or left as indicated.
Filler
Allows to highlight the area of data series in a gradient or solid way.
Labels
Allows to indicate whether the labels corresponding to the data series are displayed.
Total
Indicates whether or not the total of all series is displayed.
Example of Use
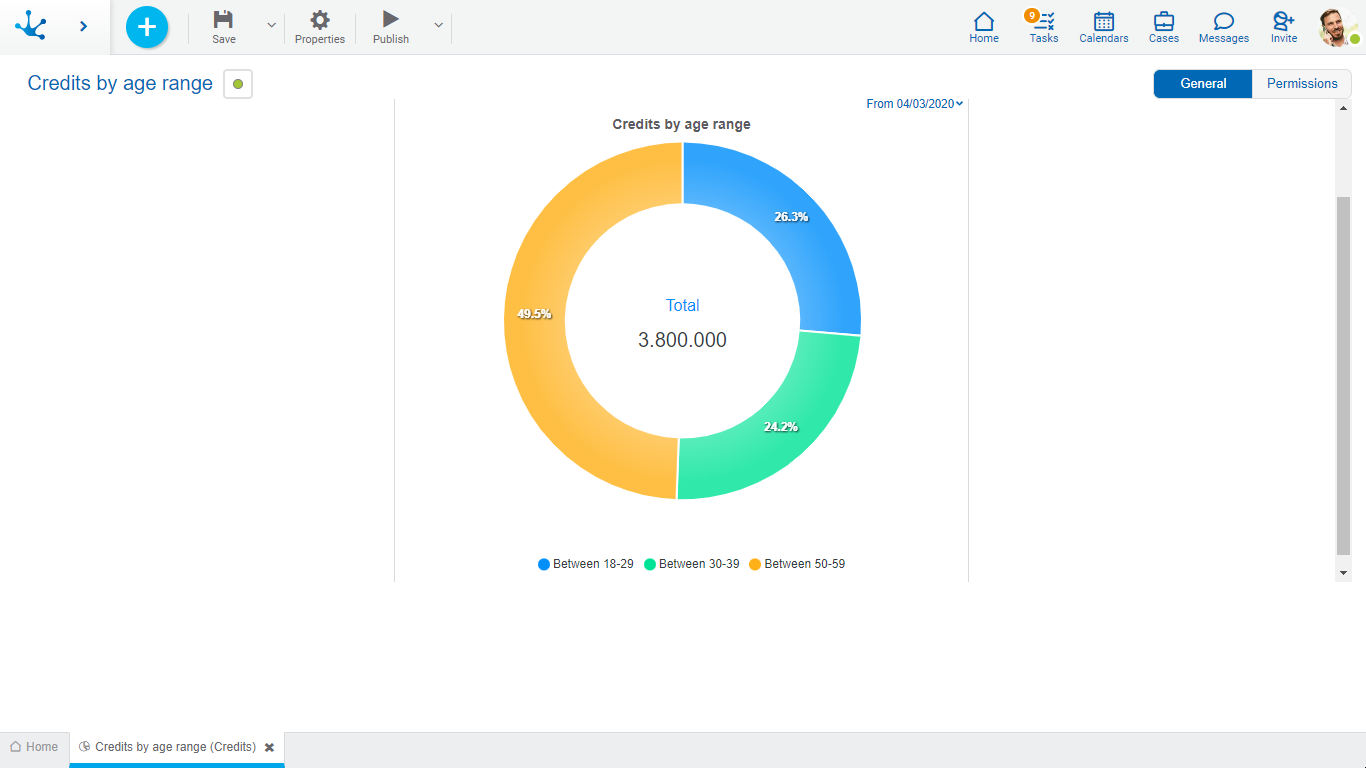
In this donut indicator the total amount requested grouped by age range is visualized, for a selected period and to the users indicated in the filter.
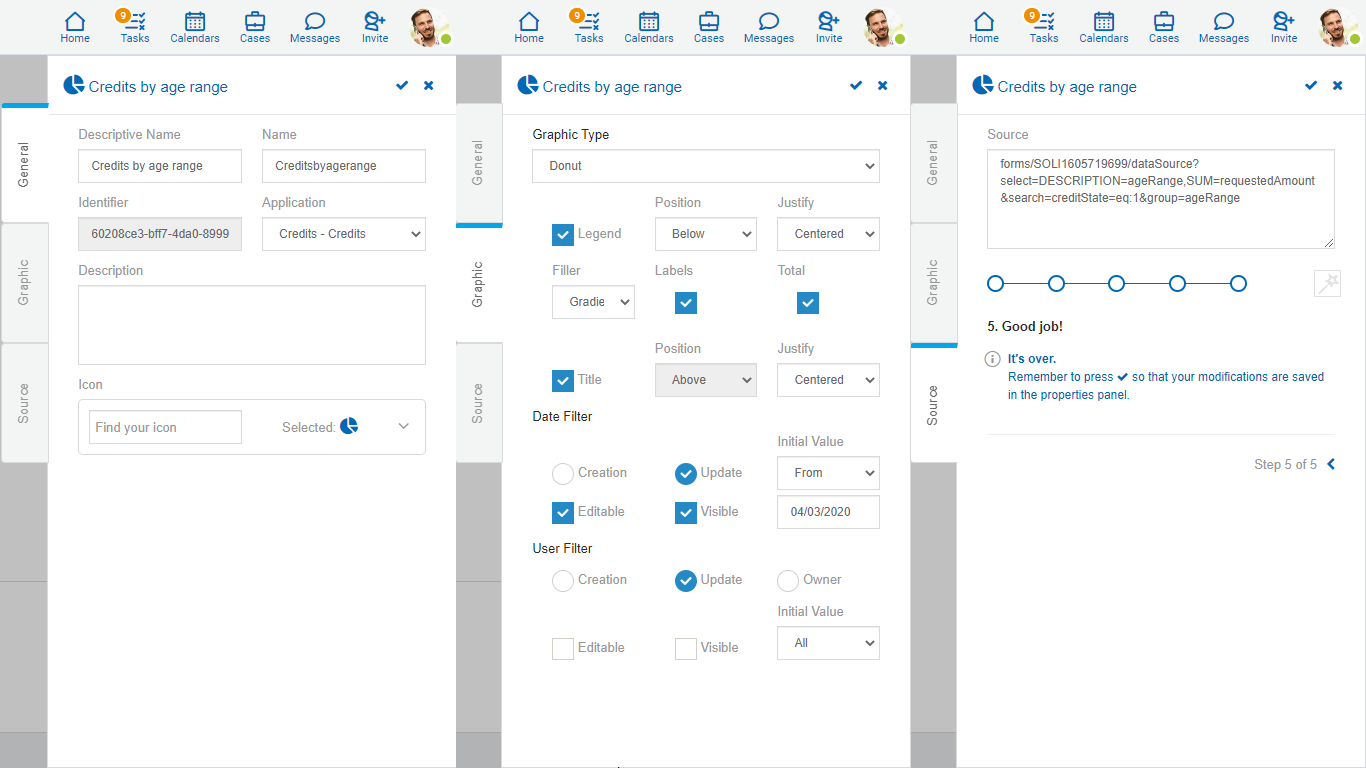
The source code to model this chart is detailed.
Steps of the Modeling Wizard
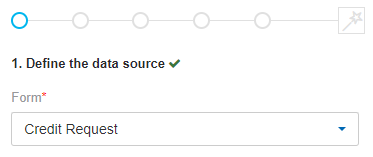
The "Credit Request" form from which the data displayed in the chart is taken should be selected.
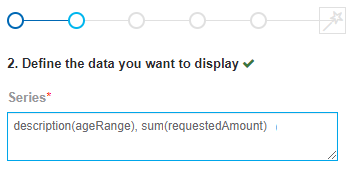
First the “AgeRange” field of the form visualized on each chart portion is indicated. And lastly the “adding(RequiredAmount)” function to determine the total amount of loans requested by age range is used.
For fields that use value lists, the "description()" function must be used to display every list value with its descriptive text, otherwise the numerical code is displayed.
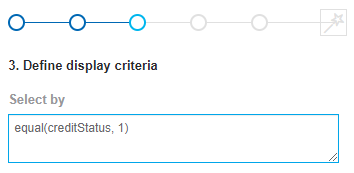
A condition is added to display all requests with "creditState=1" where "creditState" corresponds to a value list with numerical code "1" and descriptive text "Approved".
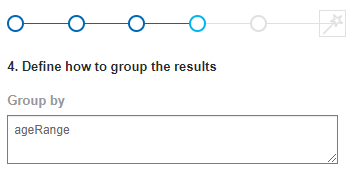
Grouping the results by the same form fields that were modeled in step 2 is defined.
In this step, the names of fields must be used without the "description()" function, despite being value lists.
Step 5 reporting that all steps are met is completed .

